|
|
Government Services Infrastructure - GSi |
|
Column
Selection and Filtering OverviewThis document explains in detail the functionalities of the GSi Monitoring tool. This document will help the intended users to understand and use the GSi Monitoring tool. Introduction
GSi Monitoring Tool is used for process monitoring,
activity/task monitoring control functions like stop/resume/restart/terminate a
process instance, view process and infrastructure related exceptions. GSi Monitoring Tool provides the dash-board view of
the processes in execution on the infrastructure. This tool provides simple and
intuitive, yet powerful mechanism to perform drill-able process monitoring.
Processes, activities and tasks can be searched based on various criteria. The
results are displayed with configurable color coding scheme based on status. Getting
Started
To install GSi Monitoring Tool,
you need to have the JRE 1.4.2 or above to be installed on the machine. Once
the JRE is installed, run the GSi Monitoring Tool installer and step thru to
screens to complete the installation. To run GSi Monitoring tool,
This will launch the Monitoring Tool.
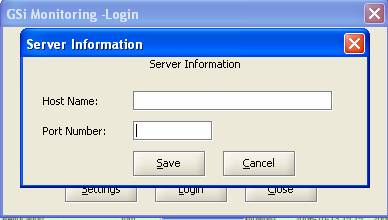
Server Information and Login
This section describes the steps involved in initial
configuration settings that needs to be done and the
login screen.
Figure 1:First time Login ·
GSi Monitoring Login
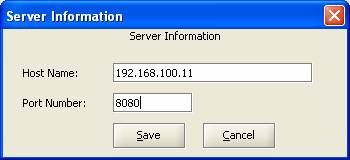
Figure 2:Server Information
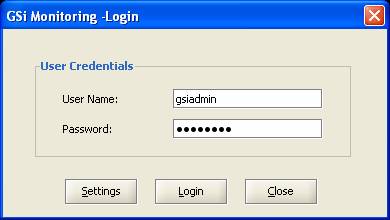
Figure 3:Login Screen
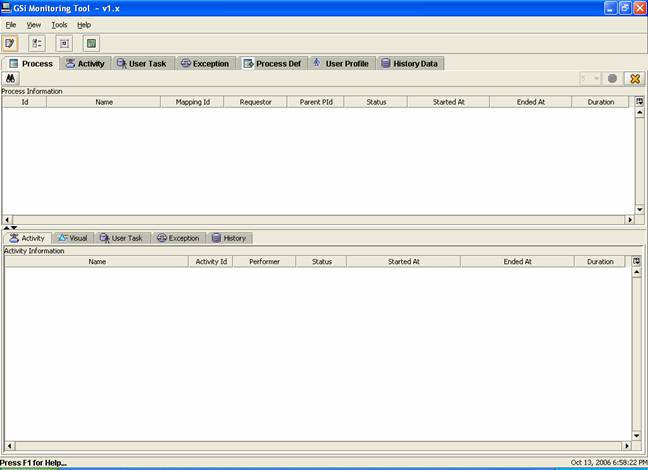
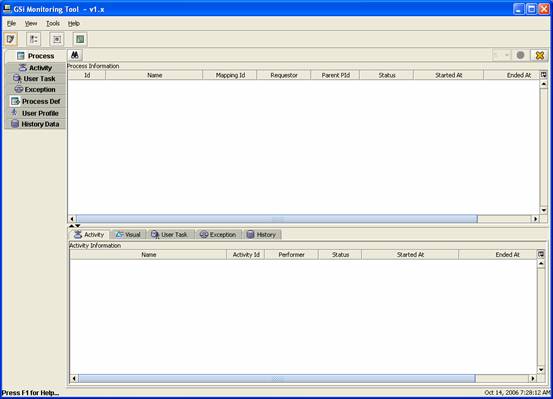
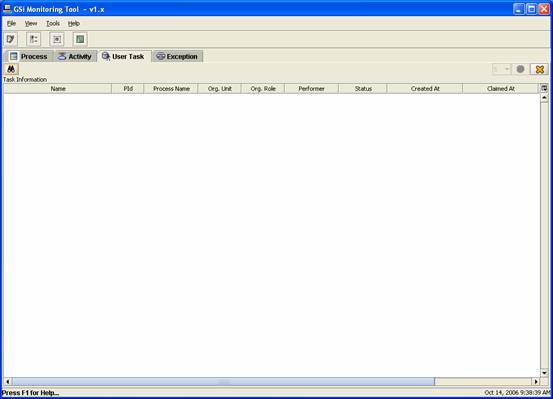
First Look
This section details the main screen of the monitoring
tool and explains the various areas in the main screen in terms of their
purpose and usage.
Figure 4:First Look At Monitoring
Monitoring Name Top Bar
Figure 5:Monitoring Name Top Bar
Monitoring
Resize Top Bar Figure 6:Monitoring Resize Top Bar ·
As Show In Figure 6 Minus Shows Minimize button
to Minimize the Monitoring. ·
As Show In Figure 6 square boxes Shows Resize /
Maximize button to Resize / Maximize the Monitoring. ·
As Show In Figure 6 X Shows Close button to close
the Monitoring. Views
This section explains the various views/windows in the
main screen of the Monitoring tool. Menu Bar
Shown
in Main Screen of Monitoring Tool (Figure 4), below (Figure 7) shows
Menu Bar. This bar is used to perform the various functions provided by the monitoring
tool.
Figure 7: Menu Bar ·
Menu Bar Contains Five Menus 1) File ·
Change Password ·
Exit 2) View ·
Tab Selection ·
Process ·
Activity ·
User Task ·
Exception ·
Process Def ·
User Profile ·
History Data ·
Tool Bar ·
Status Bar 3) Tools ·
Report ·
Preferences 4) Help ·
Help Contents ·
About Tool Tool Bar
Shown
in Main Screen of Monitoring Tool (Figure 4), below (Figure 8) shows
Tool Bar.
Figure 8:Tool Bar ·
Can be removed and can get back from (Menu Bar
View -> Tool Bar) ·
It has buttons for : o
Reporting Tool o
Preferences o
Status Color Code – Process, Activity and Task item
status based coloring codes o
Help Topics Status Bar
Shown in Main Screen of Monitoring (Below). Figure
9 shows Status Bar.
Figure 9a: Status Bar Figure 9b: Status Bar ·
Can be removed and can get back from (Menu Bar
View -> Status Bar) ·
On the left side of the Status Bar (Figure 9a)
, Shows the Status – ·
On the right side of the Status Bar
(Figure 9b), shows the current Date and Time. Tools
Preferences
Users can set preferences for certain properties
like Start Up screen, Prompt while
exiting, tab view options, tab placement
etc To
Set User Preferences ·
Menu bar Tools
-> Preferences ·
Tool Bar Preferences (Figure 8) Figure 10 :Preference Button On Tool Bar Click
on the Menu Item / Tool Bar button to get the Preference Dialog shown in the Figure
11.
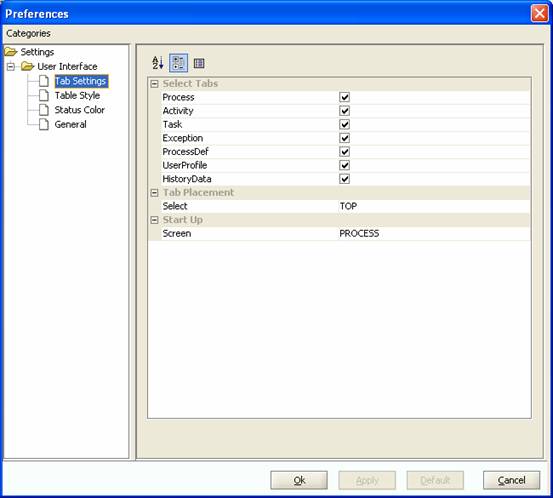
Figure 11:Preferences with Tab Settings Components
Shown Tab Settings
Figure 12:Preferences with Tab Settings Components
Shown By clicking on the Tab Settings on the left
side of the user interface tree window, displays those options on the right
side for that settings as shown in the (Figure 12). There are 3 settings for the Tab Settings, ·
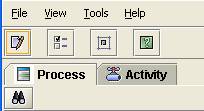
Select Tabs: By Selecting the Select
Tabs, the respective tabs are chosen to be displayed on the tabbed pane. Choose the tabs to be displayed
and click on the Apply Button and re-open the GSi Monitoring Tool for the Tabs
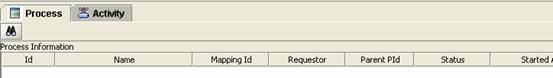
to appear accordingly. For Example, by selecting only
Process and Activity the tabs will look as shown in the below (Figure 13).
Figure 13:
Selected tabs shown ·
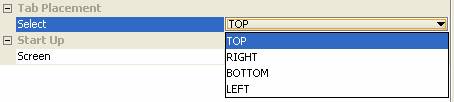
Tab Placement: The
tabbed pane can be placed either on Top/Right/Bottom/Left of the Monitoring
Tool from the selection as shown in the (Figure 14).
Figure 14:Tab
Placement Selection Screen For Example, by choosing the Tab
Placement to the LEFT shows the below (Figure 15) of the tabs in the GSi
Monitoring Tool.
Figure 15:Tab
Placement (Left) Screen ·
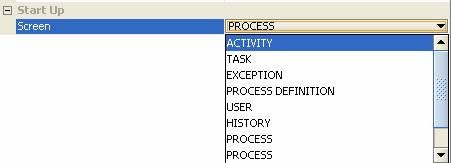
Start Up: To select the tab that
should be shown during the startup of the GSi Monitoring Tool, the selection is
as shown below (Figure 16). If the tabs that are deselected in
the Select Tab option , then those tabs will not be visible in the Start Up
option.
Figure 16:Start
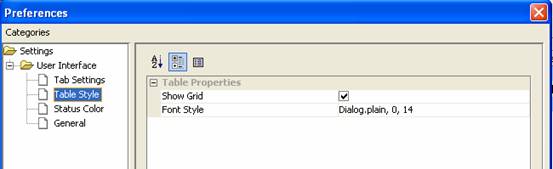
Up Selection Screen Table Style
Figure 17:Preferences with Table Style Components
Shown By clicking on the Table Style on the left side of the
window displays those options on the right side of the window as shown in the
(Figure 17). There are 2 settings in the Table Style Preference, ·
Show Grid: By selecting the show
grid option, the table across the tabs will be displayed with the grid and by
unselecting the option removes the grid of the table. ·
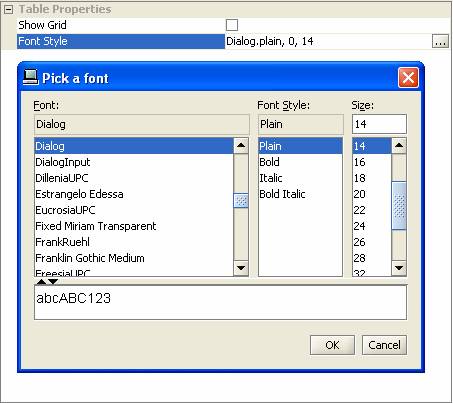
Font Style: By selecting the font
size, style and type from this option displays the table across the tabs with
the chosen font selection. As shown in the below (Figure 18).
Figure 18:
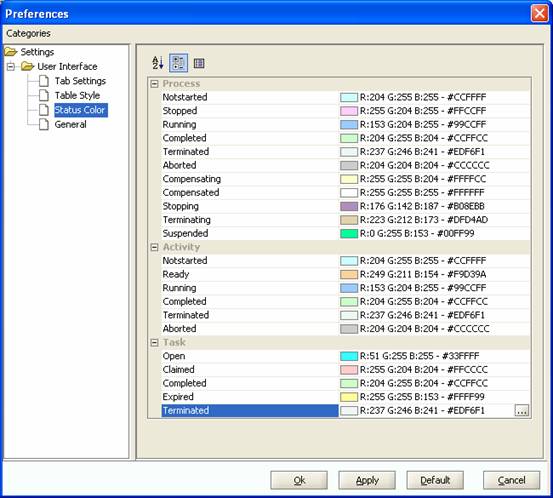
Font Style Shown Status Color
Figure 19: Status Color Screen By clicking on the Status Color on the left side of
the window displays those options on the right side of the window as shown in
the (Figure 19). This is used to set the status color code for the
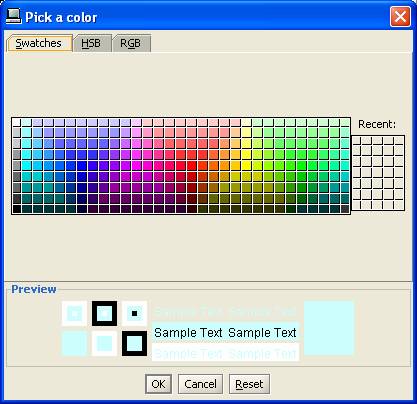
Process, Activity and Task. Step: By clicking the select font
button
Figure 20: Status Color Screen The Pick a Color window is shown to select the
appropriate color as shown in the (Figure 21) below.
Figure 21: Status Color Screen By selecting the color from the above window and by
clicking the Ok button will select the color for that particular status of the
process/activity and task. The Apply Button on the Status Color
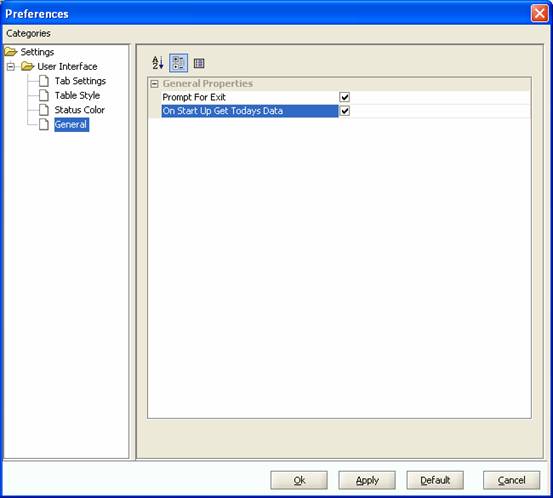
Screen (Figure 19) will apply all the set color status. General
Figure 22: General Preference Screen By clicking on the General on the left side of
the window displays those options on the right side of the window as shown in
the (Figure 22). There are 2 options: ·
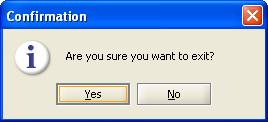
Prompt for Exit: By selecting this option
and clicking Apply Button, will prompt the user for confirmation to exit the
system from the GSi Monitoring Tool as shown in the (Figure 23) below.
Figure 23:
Confirmation Screen ·
On Start Up Get Today’s Data: By
selecting this option, the start up screen display the current day data for the
startup tab.
Preference Tool Bar
Figure 24:Preferences Tool Bar ·
Preferences Tool Bar is as in (Figure 24) ·
First button to Sort the values (rows) in A-Z Order. ·
Second button to Show / Hide Tree Table facility. ·
Third button to Show / Hide description panel.
Figure25 :Preference Button Panel
Action
Search
All the tabs in the Monitoring
tool provide the search function using which the search criteria can be
provided. Search Button
Figure26 :Preference
Button Panel By clicking on the button opens a
Search Window as shown in the Figure below. Example shown is for the Process
Search.
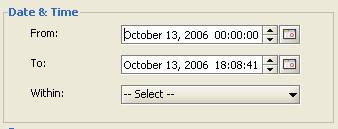
Figure27: Search Window Screen Date & Time Search: There
are three inputs for the Date and Times search as shown in the (Figure 28)
below. Manual Select From / To Date: By
clicking on the one of the fields of the month day, year seconds Note: The From
Date & Time should always be lesser than the To Date & Time.
Figure27: Date & Time
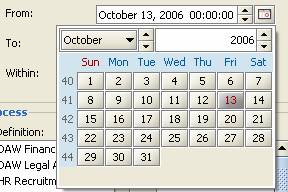
Search Screen Calendar
Selection of From / To Date: By
clicking on the calendar button
Figure28: Calendar Search
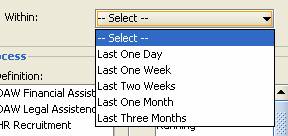
Screen Date &
Time Within: By selecting any one of the options shown from the
(Figure 29) below will search the data by day, week, month or three months.
Figure29: Within Search Screen Refresh
Options for: Process, Activity and Task Tab o
This option is located at the right top corner of the
tab pane as shown in the (Figure 29a) below. o
The data that are displayed on the tabs are refreshed
in every given interval of time. o
The refresh option for the data can be set to a
predefined interval of time and can also stop the refresh of the data. o
Initially when there are no data searched, the refresh
screen looks as in the (Figure 29a) shown below. Figure29a:
Refresh Blank Screen o
Stop Refresh: Once the Search is done
and the data is available the refresh screen looks as in the (figure 29b) shown
below. The following figure can stop the refresh which is set to an interval of
time by clicking on the Red Button.
Figure29b: Refresh Stop Screen o
Start Refresh: Once the
refresh is stopped, then the refresh screen will be as shown in the below
(Figure 29c). To start the refresh the
middle button is clicked to start the refresh set to an interval of time.
Figure29c: Refresh Start
Screen o
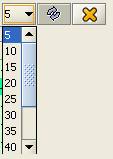
Set Refresh Interval of Time: Once the
refresh is stopped, the left drop-down is used to set the available time in
seconds as shown in the (figure 29d) below.
Figure29d: Refresh Set Screen Reload
Options for:
Exception Tab, Process Def Tab, History Tab o
This option is located at the right top corner of the
tab pane as shown in the (Figure 29a) below. o
Initially before the search, the reload button looks
as shown in the (Figure 29e) below.
Figure 29e: Reload Off Screen o
Once the search is done and the data is available, the
reload option appears as shown in the (Figure 29f) shown below. Click on the
left button to start the reload to be active.
Figure 29f: Reload Set Screen Close
This option is located at the
right top corner of the tab pane as shown in the (Figure 29g) below. This
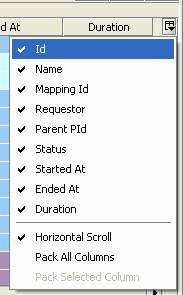
option is used to close that particular Tab. Figure 29g: Close Screen Column Selection and Filtering
This
option is located at the right top corner of every table display as shown in
the (Figure 29g) below. This
option is used to select the table columns to be displayed. By ticking enables
the column to appear and vice-verse.
Tabs
This section describes
all the tabs/screen used for monitoring of the processes and audit trail
information like process definition and user profile events. Process Tab
The Process Tab as shown in the
(Figure 36) below displays the Process Instances. The information displayed is
as follows: ·
Id ·
Name - (Process Name) ·
Vertical Mapping Id (Unique Id given by Vertical) ·
Parent Process Id – (Sub-process referring to Parent
Process) ·
Status - (Current Status of the Process Instance) ·
Started At ·
Ended At ·
Duration Figure29:
Within Search Screen Search
To fetch the Process Instance
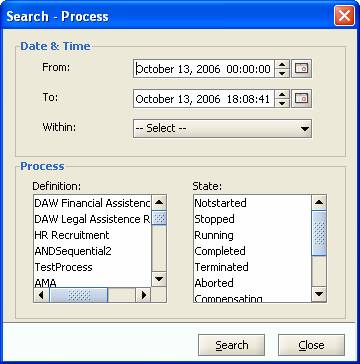
Data, the search has to be done with Time & Date Process
Definition and By
clicking on the Search Button, the search window appears and the search for the
Time and Date can be referred from the Action Search Section and the Process
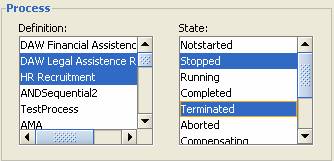
Definition and Status is as shown in (Figure 30)below.
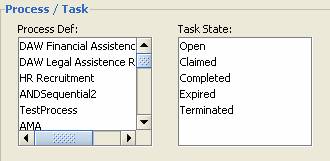
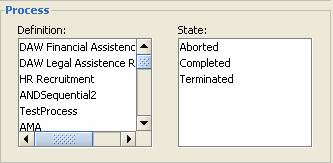
Figure30: Process Search Screen The
Process Definition and States can be selected by clicking on the list and
multiple select of the definitions and status can be done as shown in the
(Figure 30) above. If the list from the Process Definition and States are not
selected then all the values from both the lists are considered to be chosen by
default. Once the
Time & Date, Process Definition and States are selected, by clicking on the
Search Button from the Search Window will display the Process Instances
respectively. View
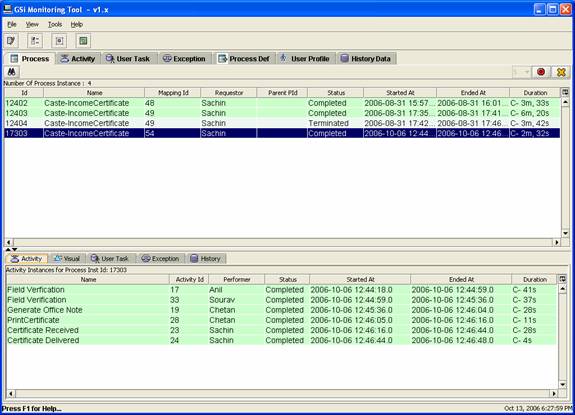
Once the Search is completed and the Process Instances
results are displayed in the Process Tab Screen as shown in the Figure below. Figure31:
Process Tab Result Screen Process
Instance Selection
To select a Process Instance from
the Process Instance Tab, double-click on a particular Process Instance that
needs to be selected as shown in the (Figure 32) below. The dark blue color
code shows the Process Instance being selected. The selection can also be
performed thru keyboard by using Up/Down arrow key and pressing the ENTER
key.
Figure32:
Process Instance Selection Screen Activity
Detail
The Process
detail tab pane below the Process tab shows the various process
instance related detail tabs. Click
on the Activity to
see the activities. The Activities are displayed for the selected Process
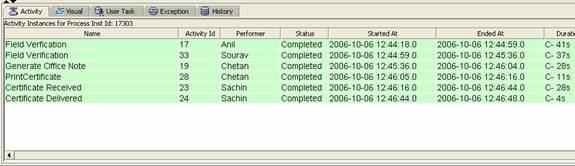
Instance. The details of activities are as shown in the (Figure33) below. The Activity details are displayed are as shown from
the (Figure 32): ·
Activity Name ·
Activity Id ·
Performer ·
Status ·
Started At ·
Ended At ·
Duration Figure32:
Activity Detail Tab Screen Visual
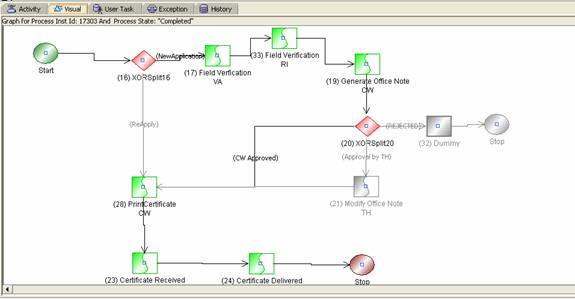
Click
on the Visual tab to see the visual representation of the process in the
current state as shown in the (Figure 33) below. The
process diagram represents the current state of the process instance and the path
taken. The activities in the executed path till now are highlighted in bright
colors where as activities not executed are shown in shaded color. The visual
view is as shown in the (Figure 33) below. Figure33:
Visual Tab Screen Task Details
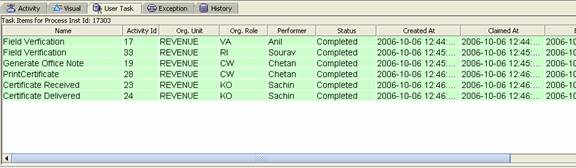
Click
on the Task Tab to see the User Task information for that particular Process
Instance chosen as shown in the (Figure 34) below. The User Task Details are displayed are as shown from
the (Figure 34): ·
Name ·
Activity Id ·
Organization Unit ·
Organization Role ·
Performer ·
Status ·
Generated At ·
Claimed At ·
Duration Figure34:
Task Detail Tab Screen Exception Details
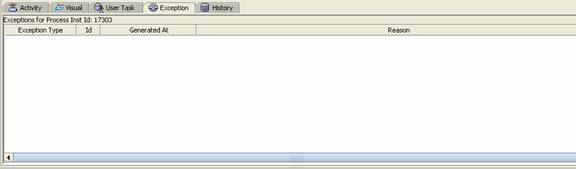
Click
on the Exception Detail Tab to see the Exceptions for that particular Process
Instance chosen as shown in the (Figure 35) below. The Exception Details are displayed are as shown from
the (Figure 35):
Figure35:
Exception Detail Tab Screen History
Details
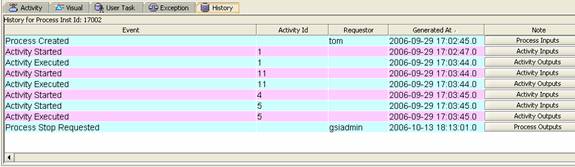
Click
on the History Detail Tab to see the audit data(Process
Created, Activity Started, Activity Executed, Process Stop Requested, Process
Stopped, Process Completed) stored for the events for that particular Process
Instance chosen as shown in the (Figure 36) below. The History Details are displayed are as shown from
the (Figure 36):
Figure36:
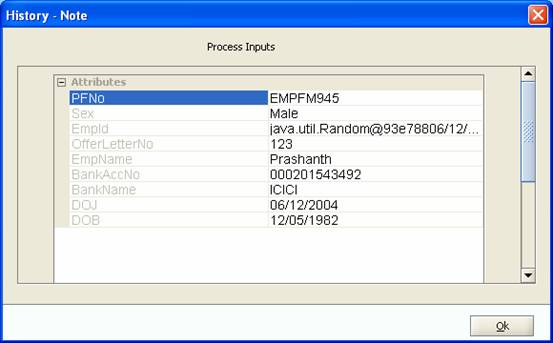
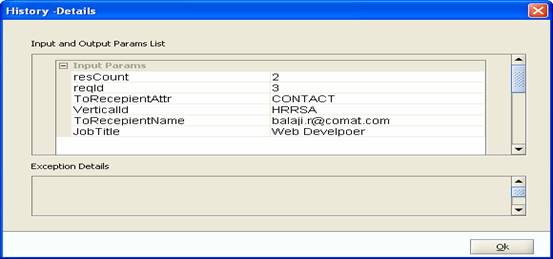
History Detail Tab Screen The Process Inputs
are viewed by clicking the Process Inputs button
Figure37:
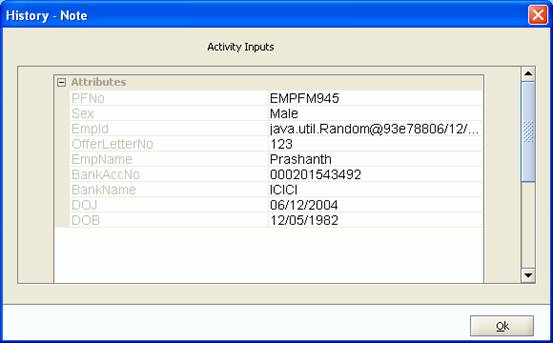
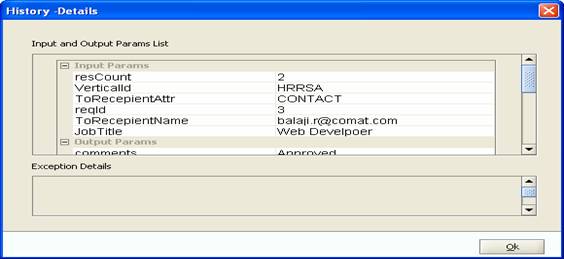
History Detail – Process Inputs Screen The Activity Inputs are viewed by clicking the Activity
Inputs button
Figure38:
History Detail – Activity Inputs Screen Functionalities
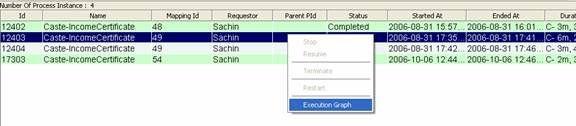
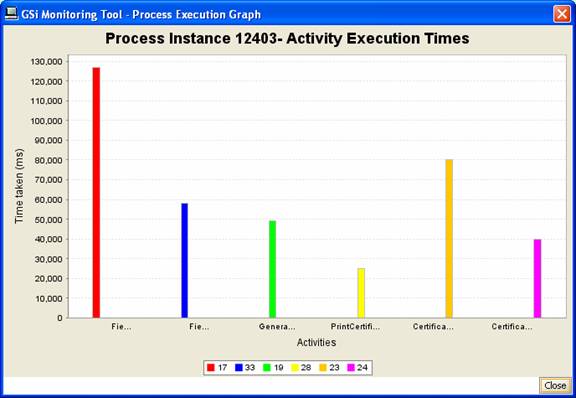
Execution
Graph The
Execution Graph displays the Activity Execution Times for a Process Instance. By right-clicking
on the Process Instance to be chosen from the Process Tab, pops-up a window as
shown in the (Figure 39) below.
Figure39:
Selecting Execution Graph Screen By
selecting the Execution Graph from the pop-up screen shows the Process
Execution Graph Screen as shown in the (Figure 40) below.
Figure40:
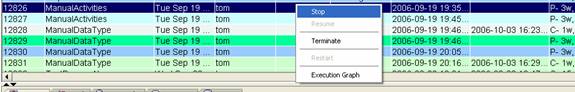
Activity Execution Graph Screen Stop
Process To Stop
a process Instance, the process Instance should be running.
Figure41:
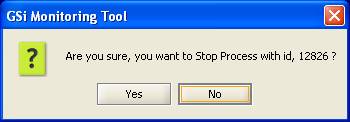
Process Instance Stop Selection Screen
Figure42:
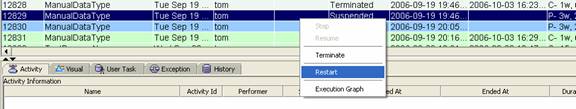
Process Instance Stop Confirmation Screen Restart
Process To restart a process Instance, the process
Instance should be suspended.
Figure43:
Process Instance Restart Screen
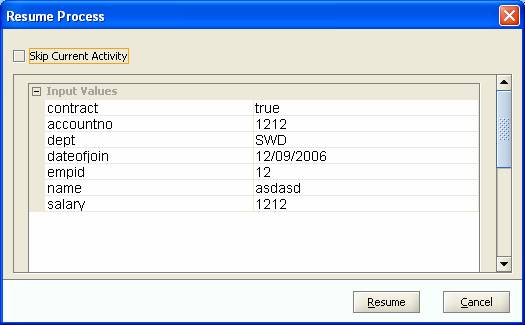
Figure45: Present Activity Inputs Screen
Figure46:
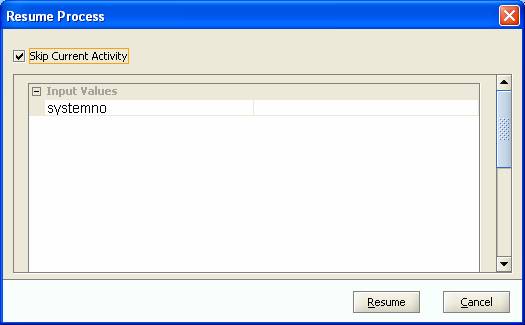
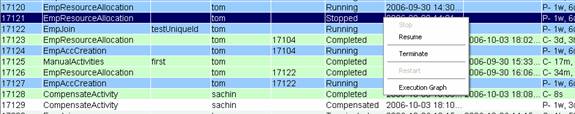
Next Activity Inputs Screen Resume
Process To resume a process Instance, the process
Instance should be stopped.
Figure44:
Process Instance Resume Screen
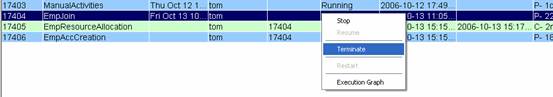
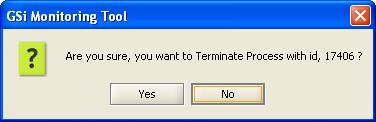
Terminate To terminate a process Instance, the process
Instance should be in an open state and should not be in closed state (Completed,
Aborted, and Terminated).
Figure47:
Terminate Process Instance Selection Screen .
Figure48:
Terminate Process Instance Confirmation Screen
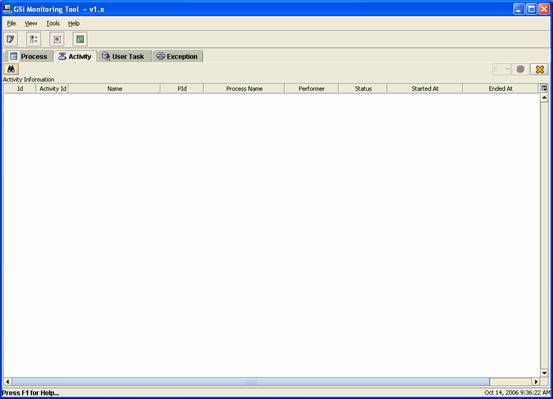
Activity Tab
The Activity Tab as shown in the (Figure 49) below,
displays all the Activity Instances for the processes and activity state selected The
information displayed will be as follows. ·
Id - (Activity
Instance Id) ·
Activity Id - (Activity Definition Id) ·
Name ·
PId –
(Process Instance Id) ·
Process Name ·
Performer – (Only for Manual Activities) ·
Status – (Current Status of the Activity) ·
Started At ·
Ended At ·
Duration
Figure48:
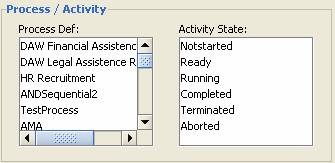
Activity Tab Screen Search
To fetch the Activity Instance Data, the search has to
be done with Time & Date Process Definition and By
clicking on the Search Button, the search window appears and the search for the
Time and Date can be referred from the Action Search Section and the Process
Definition and Activity State is as shown in (Figure 49)below.
Figure49:
Activity Tab Search Screen The
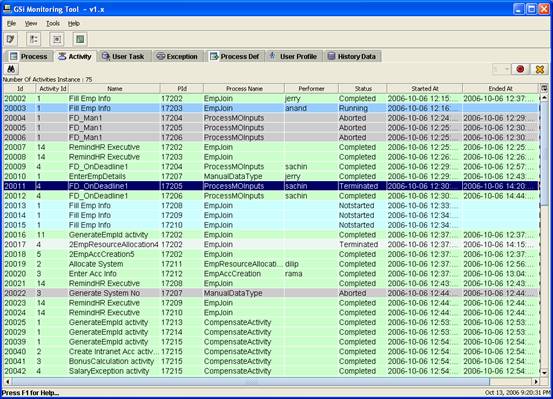
Process Definition and Once the
Time & Date, Process Definition and View
Once the Search is completed and the Activity
Instances results are displayed in the Activity Tab Screen as shown in the (Figure
50) below.
Figure50:
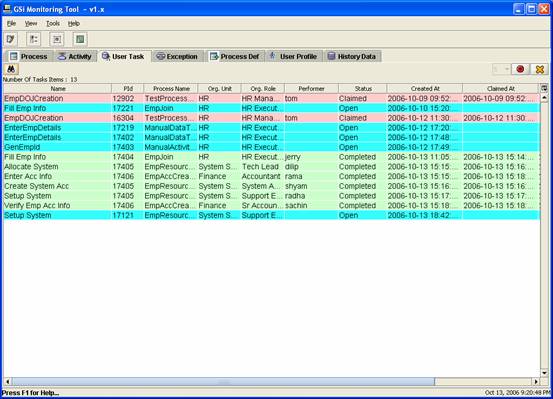
Activity Tab Result Screen User Task Tab
The User Task Tab as shown in the (Figure 51) below, all
the task items for the processes and task state selected. The information displayed will be as follows. ·
Name – (Task Name) ·
PId –
(Process Instance Id) ·
Process Name ·
Organization Unit ·
Organization Role ·
Performer ·
Status – ( ·
Created At ·
Claimed At ·
Ended At ·
Duration
Figure51:
User Task Tab Screen Search
To fetch the User Task Data, the search has to be done
with Time & Date Process Definition and By clicking
on the Search Button, the search window appears and the search for the Time and
Date can be referred from the Action Search Section and the Process Definition
and Task states is as shown in (Figure 52)below.
Figure52:
User Task Tab Search Screen The Process
Definition and Once the
Time & Date, Process Definition and View
Once the Search is completed and the User Task results
are displayed in the User Task Tab Screen as shown in the (Figure 53) below.
Figure53:
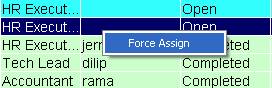
User Task Tab Result Screen Functionalities
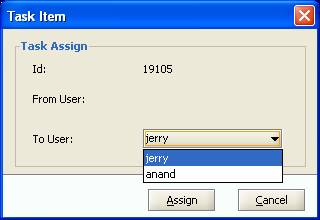
Force Assign To force
assign a task to a user, right-click on the open task, a pop-up with Force
Assign option appears as shown in the (Figure 54) below.
Figure54: Force Assign Selection Screen
Figure55: Force Assign Confirmation Screen
Figure56: User Assign Screen Exception Tab
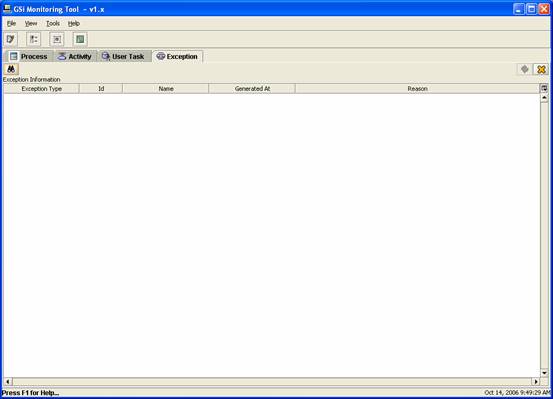
The Exception Tab as shown in the (Figure 57) below,
displays the Exceptions based on selected from and to dates. This tab shows the
process and activity exceptions. The information shown will be as follows: ·
Exception Type – (Process / Activity) ·
Id ·
Name ·
Generated At ·
Reason
Figure57: Exception Tab Screen Search
To fetch
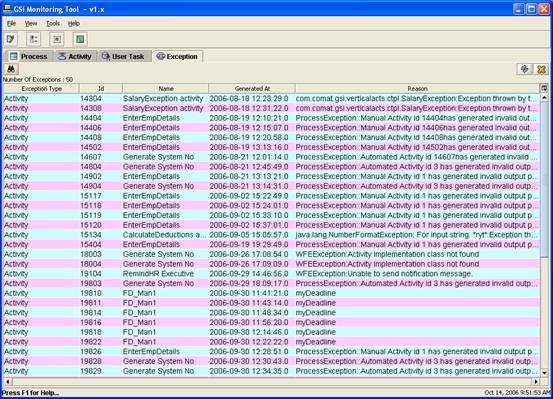
the Exception Data, the search has to be done with Time & Date. View
Once the Search is completed, the
Exception results are displayed in the Exception Tab Screen as shown in the
(Figure 58) below.
Figure57: Exception Tab Result Screen User Profile
The User Profile Tab as shown in the (Figure 58) below, displays the User Profile events. The user profile
events are the User, Group and Role management events (add, modify &
remove). There are three corresponding tabs displayed and the information shown
in each of them is as shown below: ·
User o
Event Name o
Occurred At o
User Name o
Group/Role Name o
Performed By ·
Group o
Event Name o
Occurred At o
Group Name o
Parent Group Name o
Performed By ·
Role o
Event Name o
Occurred At o
Role Name o
Privileges Name o
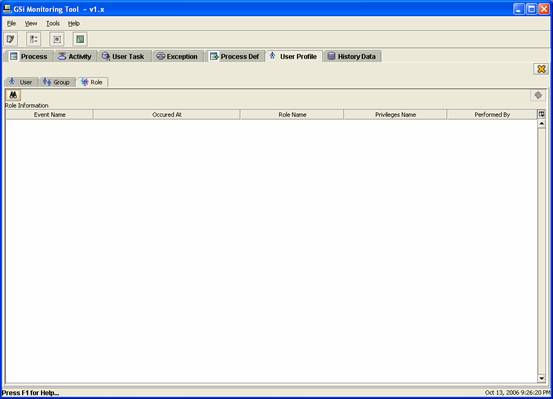
Performed By User, Group and Role details are
displayed from the User Profile Tab as shown in the (Figure 58) below.
Figure57: User Profile Tab Screen The User, Group and Role Tabs are
used to choose the respective tabs as shown in the (Figure 58) below.
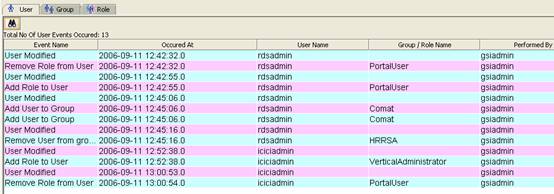
Figure58: User Profile Detail Tab Screen User View
Once the Search is done with the
given Time and Date, the User management events are displayed as shown in the
(Figure 59) below.
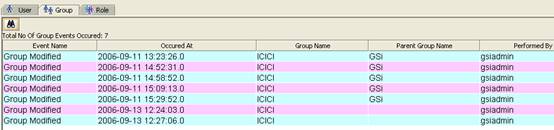
Figure59: User Tab Screen Group View
Once the Search is done with the
given Time and Date, the Group management events are displayed as shown in the
(Figure 60) below.
Figure60: Group Tab Screen Role View
Once the Search is done with the
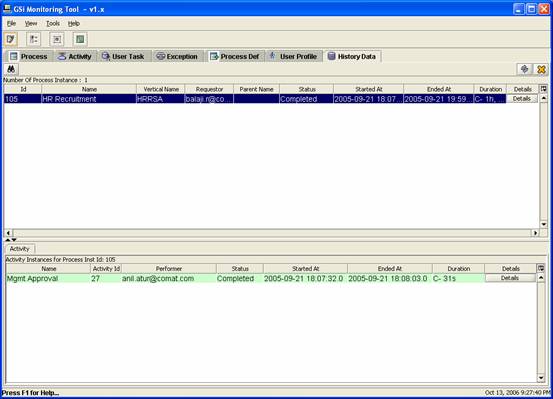
given Time and Date, the Role results are displayed. History Data
Tab
The History Tab as shown in the
(Figure 61) displays the archived process instance information. The live
process instance information for ended processes is periodically moved to the
archive database. History data tab queries on this db and shows the results. The
information shown is as follows: ·
Process Instance o
Id o
Name o
Vertical Name o
Parent Name o
Status o
Started At o
Ended At o
Duration ·
Activity Instance o
Name o
Activity Id o
Performer o
Status o
Started At o
Ended At o
Duration
Figure61: History Tab Screen Search
To fetch the History Data, the search has to be done
with Time & Date Process Definition and State’s. By
clicking on the Search Button, the search window appears and the search for the
Time and Date can be referred from the Action Search Section and the Process
Definition and States is as shown in (Figure 62)below.
Figure62:
History Search Screen The
Process Definition and States can be selected by clicking on the list and
multiple select of the definitions and states can be done as shown in the
(Figure 62) above. If the list from the Process Definition and States are not
selected then all the values from both the lists are considered to be chosen. Once the
Time & Date, Process Definition and States are selected, by clicking on the
Search Button from the Search Window will display the History Information is
displayed. View
Once the Search is completed and
the History results are displayed in the History Tab Screen as shown in the
(Figure 63) below.
Figure63:
History Result Screen o
The top window in the History Tab Screen is the
Process Instance Details and the bottom shows the Activity Instance for that
Process Instance Selected. Details: By selecting the button Details
Figure64: Process Instance Detail Screen
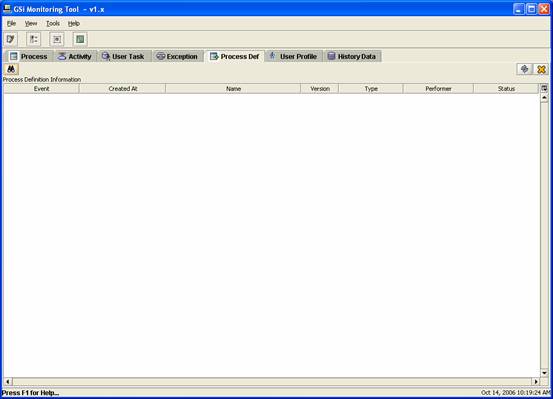
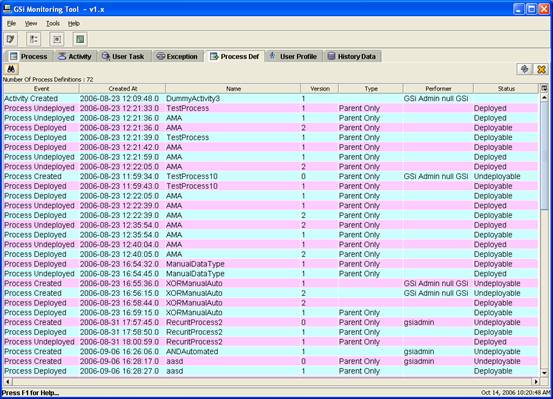
Figure65: Activity Instance Detail Screen Process Definition
The Process Def (Definiton) tab
as shown in the (Figure 66) below displays the Process Definition events. The
process definition events like Create new process, make process deployable,
process deploy and un-deploy are displayed based on
the selected data criteria. The information displayed is as follows: ·
Event ·
Created At ·
Name (Process Name) ·
Version ·
Type (Type of process – Parent, Sub-process, Both) ·
Performer ·
Status (The current status change)
Figure66: Process Def Tab Screen Search
To fetch the Exception Data, the
search has to be done with Time & Date. View
Once the Search is completed and
the Process Def results are displayed in the Process Def Tab Screen as shown in
the (Figure 67) below.
Figure67: Process Def Tab Result Screen |


©2004-2009 Comat Technologies Pvt. Ltd.